Stop Screenshotting Mailchimp: Build a Live Email Marketing Dashboard in Google Slides
July 12, 2026
You know the drill. It’s Monday morning, and the weekly marketing meeting is in an hour.
You log into Mailchimp (or ConvertKit, or ActiveCampaign...). You find the latest campaign report. You wrestle with your computer’s screen capture tool, trying to get a clean shot of the open rates and click-throughs.
You paste the blurry, pixelated image into your Google Slides deck. It looks… fine. But it doesn't match your brand colors, you can't edit the labels, and you know it will be completely out of date by tomorrow.
This workflow is a time sink. And frankly, it makes your reports look amateurish. There’s a much, much better way.
The Problem with Static Screenshots
Pasting screenshots into your presentations is a dead-end street.
- They're Instantly Stale: The data is frozen in time. If someone asks for the very latest numbers, you have to start the whole process over.
- They're Un-editable: That awkward title on the Mailchimp graph? The weird color scheme? You're stuck with it. You can't tweak a single thing.
- They Look Unprofessional: Let's be honest, they rarely look good. They break the visual flow of your presentation and scream "I copied and pasted this from another website."
What if your Google Slides deck wasn't just a collection of static images, but a living, breathing dashboard that you could update in seconds?
Build a "Live" Dashboard with ExtraChart
This is where you change the game. Instead of relying on screenshots, you can create beautiful, native, and updatable charts directly inside Google Slides using our add-on, ExtraChart.
Think of it as your central hub for email marketing KPIs. One slide, all your key metrics, always looking sharp.
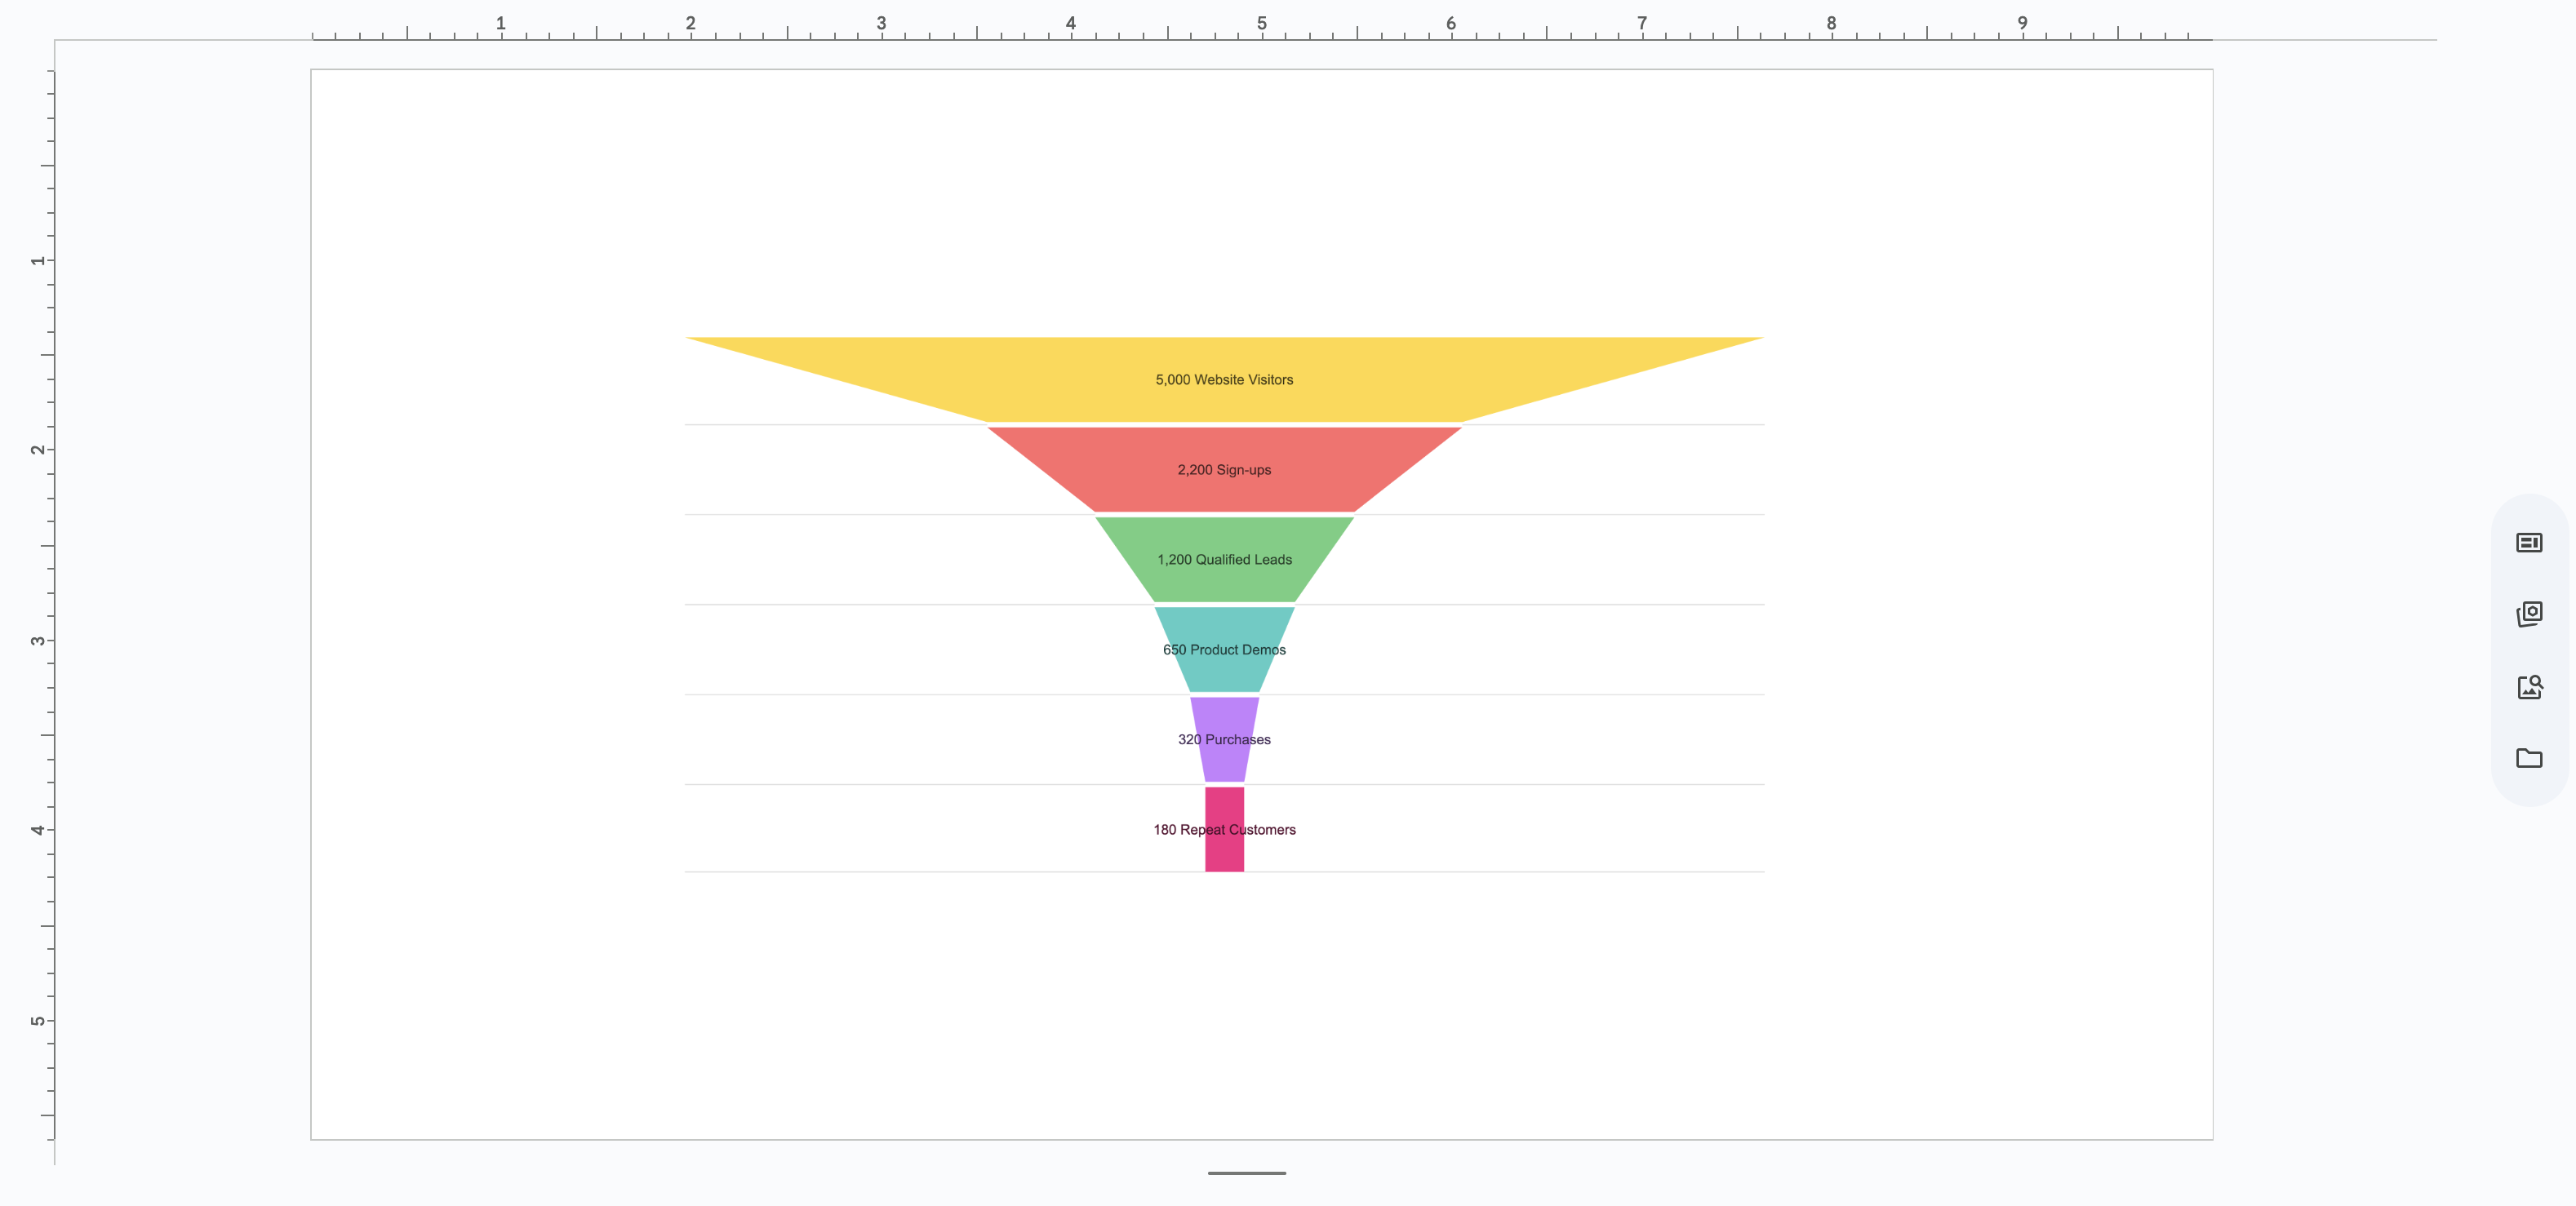
Let’s build a core component of any email dashboard: a conversion funnel.
Step 1: Get Your Funnel Data
First, grab your numbers. You don't need a complex export. Just find the key stages of your latest campaign or automation sequence.
For example:
- Emails Sent: 10,000
- Emails Opened: 3,500
- Clicked Link: 875
- Made a Purchase: 120
Step 2: Create a Funnel Chart in Slides
Now for the fun part. Forget screenshots.
- In Google Slides, go to the menu: Extensions -> ExtraChart -> Create & Edit Charts.
- The ExtraChart sidebar will open with a library of chart types. Find the Funnel Chart and click it.
Step 3: Paste Your Data & Customize
A popup editor will appear. This is where the magic happens.
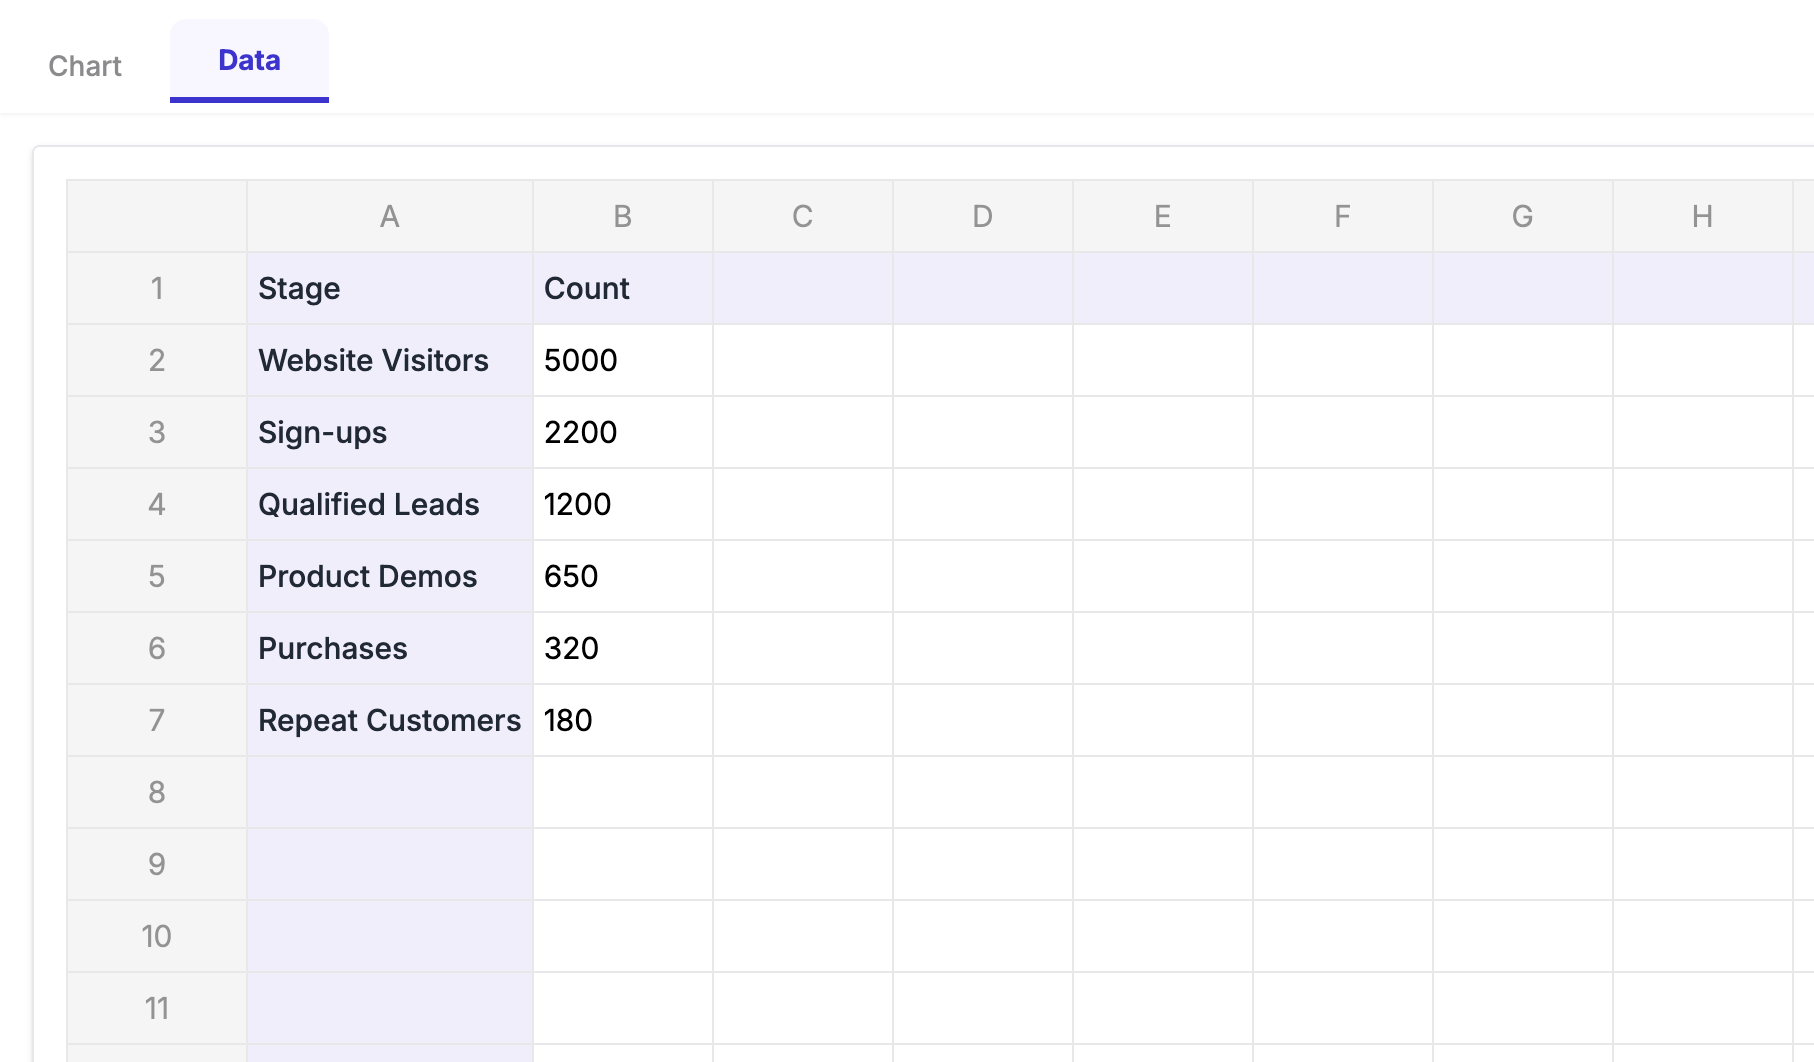
On the Data tab, you’ll see a simple spreadsheet interface. Just copy and paste your numbers from Step 1 directly into the cells. The chart preview on the left will update instantly.
Switch to the Settings tab. Here you can:
- Change the colors to match your company's brand palette.
- Adjust fonts, labels, and spacing.
- Fine-tune every aspect until it's pixel-perfect.
Click "Create," and a crisp, high-resolution chart is inserted directly onto your slide. No pixels, no blur.
Step 4: The One-Click Update (The Best Part)
This is what makes it a "live" dashboard.
Next week, when you have new numbers, you don't start over. You simply:
- Click on the funnel chart image you already made.
- Open ExtraChart again (
Extensions -> ExtraChart -> Create & Edit Charts). - The add-on automatically loads your existing chart's data and settings.
- Paste in the new numbers.
- Click "Update."
Boom. Your chart is instantly refreshed with the latest data, right there on the slide. It takes about 10 seconds. Your weekly reporting just got 90% faster and 100% more professional.
Beyond the Funnel
A funnel is just the start. You can build out an entire dashboard slide using other charts from ExtraChart:
- Bar Charts: Perfect for comparing the open rates of A/B test campaigns.
- Line Charts: Track your subscriber list growth over the last quarter.
- Bullet Charts: See if your click-through rate is hitting its monthly target.
Stop the screenshot scramble. Elevate your reports from static, boring images to a dynamic, impressive dashboard. Give ExtraChart a try and spend your Monday mornings on analysis, not on cropping images.