How to Create Stacked & Grouped Bar Charts in Google Slides™ (Properly)
December 16, 2025
Stacked and grouped bar charts are commonly used to compare values and to show how individual parts contribute to a whole. In Google Slides™, these charts can be created using linked data sources or presentation-focused tools, depending on how much control and visual precision is required. This guide explains when to use each chart type and how to create clear, presentation-ready results in Google Slides™.
Understanding Stacked vs Grouped Bar Charts
Before creating a chart, it’s important to choose the right structure.
Stacked Bar Charts
Stacked bar charts are best used when the goal is to:
- Show total values
- Illustrate how different components contribute to that total
Common examples include budget breakdowns, revenue by segment, or resource allocation by department.
Grouped Bar Charts
Grouped bar charts are useful when the goal is to:
- Compare values across categories
- Keep each data series visually distinct
They work well for performance comparisons, trends across periods, or side-by-side evaluations.
Creating Stacked & Grouped Bar Charts in Google Slides™
Google Slides™ allows chart creation through connected Google Sheets™ data. This approach works well for collaborative environments and basic reporting needs.
When working with stacked or grouped bars, it helps to:
- Structure data clearly in the source sheet
- Limit the number of categories to maintain readability
- Use consistent labeling and ordering
For simple presentations, this method is often sufficient.
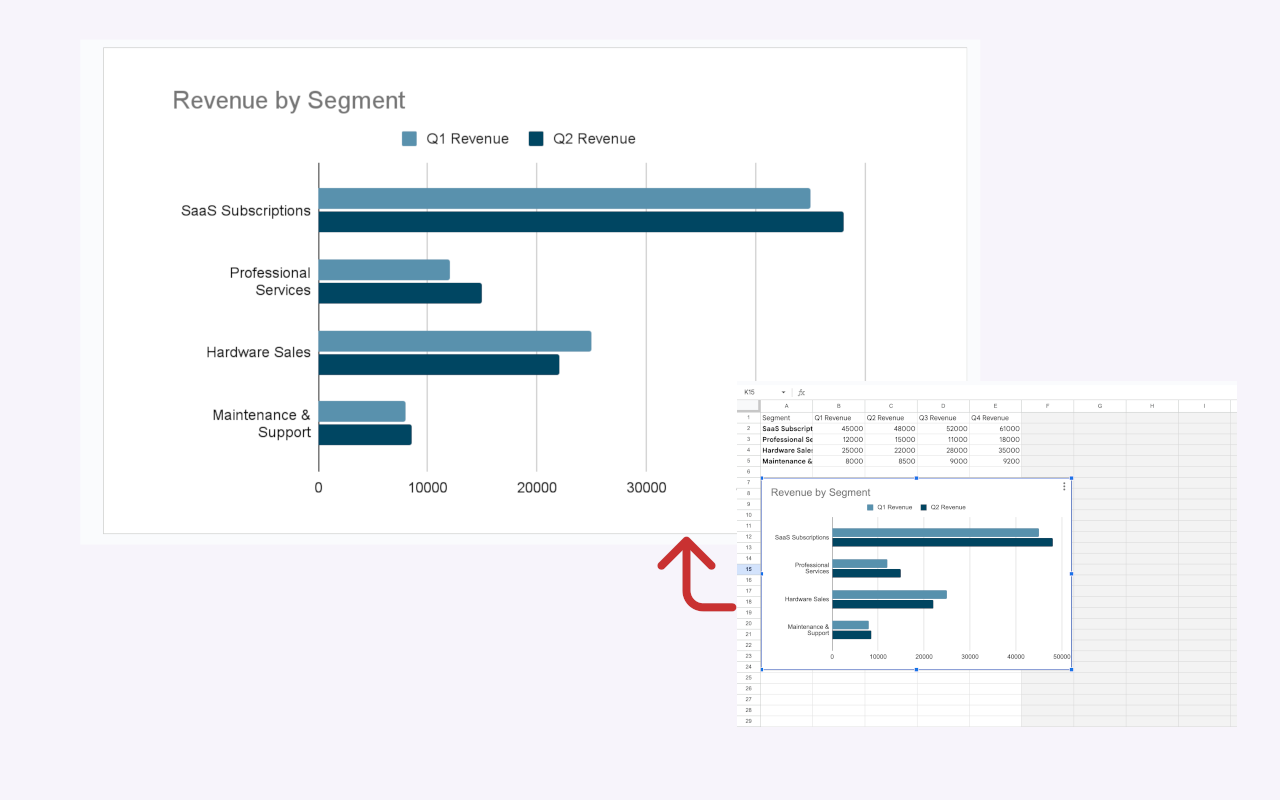 Creating a chart in Google Slides™ linked to Google Sheets™ data.
Keeping Charts Clear and Presentation-Ready
As charts become more complex, clarity becomes more important than detail. Small design choices can significantly affect how a chart is perceived by an audience.
Key considerations include:
- Adequate spacing between bars
- Consistent color usage across slides
- Readable labels that don’t overlap
- Visual balance within the slide layout
These details are especially important in executive, client, or investor presentations, where charts are expected to support the message without drawing attention to formatting.
A Presentation-First Approach to Charts
In many cases, presenters look for workflows that prioritize how charts appear in the slide, rather than how they are generated in a spreadsheet.
A presentation-first approach focuses on:
- Visual consistency across multiple slides
- Faster iteration when data changes
- Charts that remain stable once placed in a deck
This is the approach taken by tools like ExtraChart, a Google Slides™ add-on designed specifically for creating presentation-ready stacked and grouped bar charts. Charts are inserted directly into Slides as clean visuals, with layouts optimized for presentations rather than spreadsheets.
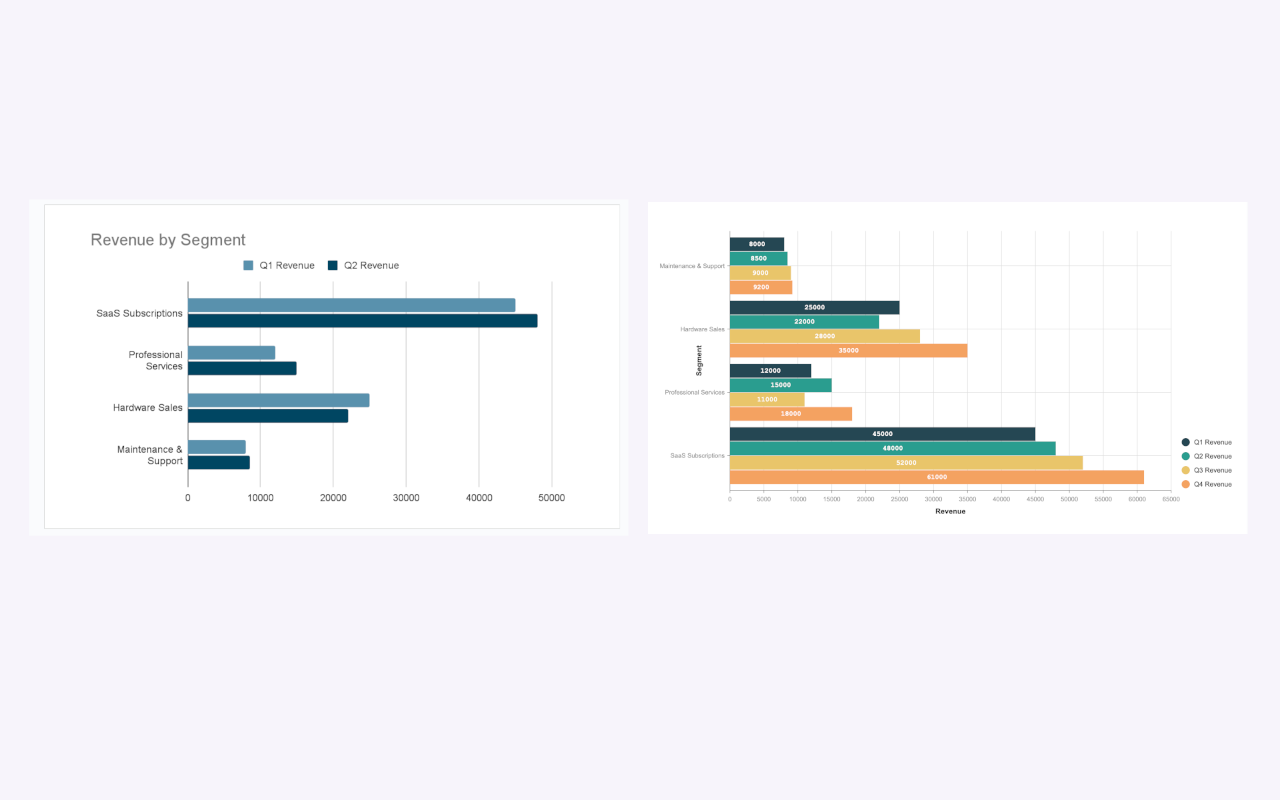 Side-by-side comparison of a default chart and a presentation-optimized chart.
When Stacked and Grouped Bar Charts Matter Most
Well-designed bar charts are especially valuable in:
- Business and sales reports
- KPI and performance reviews
- Consulting and strategy decks
- Product or financial presentations
In these contexts, clarity and consistency help the audience focus on insights rather than interpretation.
Final Thoughts
Stacked and grouped bar charts are powerful tools for communicating comparisons and proportions. In Google Slides™, achieving clear results is less about adding complexity and more about choosing the right workflow for the presentation.
For straightforward needs, built-in chart options may be enough. For presentations where visual quality, consistency, and efficiency matter, using a presentation-focused approach can make the process smoother and the outcome more effective.
If you regularly work with stacked or grouped bar charts in Google Slides™ and want more control over how they appear in your presentations, ExtraChart is available in the Google Workspace™ Marketplace.
Create Better Charts in Google Slides™
Try ExtraChart to build presentation-ready stacked and grouped charts effortlessly.
Get Started for Free