How to Create a Social Media Dashboard in Google Slides (That Actually Updates Itself)
June 16, 2026
Let’s be honest. That recurring calendar notification, “Prepare weekly social media report,” probably doesn’t fill you with joy.
You know the drill. Export a CSV from your scheduling tool, wrangle with Google Sheets to make a half-decent chart, copy it over to Google Slides, and then spend 20 minutes fighting to make the colors and fonts match your brand.
Next week? You do it all over again. It’s a tedious, soul-crushing cycle.
What if you could build your dashboard once in Google Slides, and then update it with fresh data in under a minute? Not by linking to a fragile Google Sheet, but right inside your presentation.
It’s completely possible. Here’s how.
The Problem: Native Charts Are a Dead End
Google Slides is fantastic for presentations, but its built-in charting tools are… basic. They get the job done for a simple bar graph, but they’re not designed for professional, recurring reports.
The biggest issue? They’re static.
Once you paste a chart in from Google Sheets, it becomes a disconnected object. When you have new data, your options are terrible:
- Go back to Sheets, update the data, create a new chart, and replace the old one in Slides (and fix the formatting all over again).
- Try the "Linked object" feature, which is notoriously clunky and often breaks formatting when you hit "Update."
This workflow is precisely why reporting feels like such a chore. You're not analyzing data; you're just a glorified copy-and-paste machine.
Build Your Dashboard Foundation Inside Slides
This is where you change the game. Instead of treating Google Slides as the final destination for your charts, you can build them directly inside it with an add-on like ExtraChart.
This isn't just about making prettier charts (though that's a huge plus). It's about creating a workflow that respects your time.
Here's the process:
- First, install ExtraChart from the Google Workspace Marketplace.
- In Google Slides, go to Extensions -> ExtraChart -> Create & Edit Charts.
The ExtraChart sidebar opens up with 20 different chart types, including many you won't find in Google Slides, like Funnel, Bullet, and Radar charts. These are perfect for a social media dashboard.
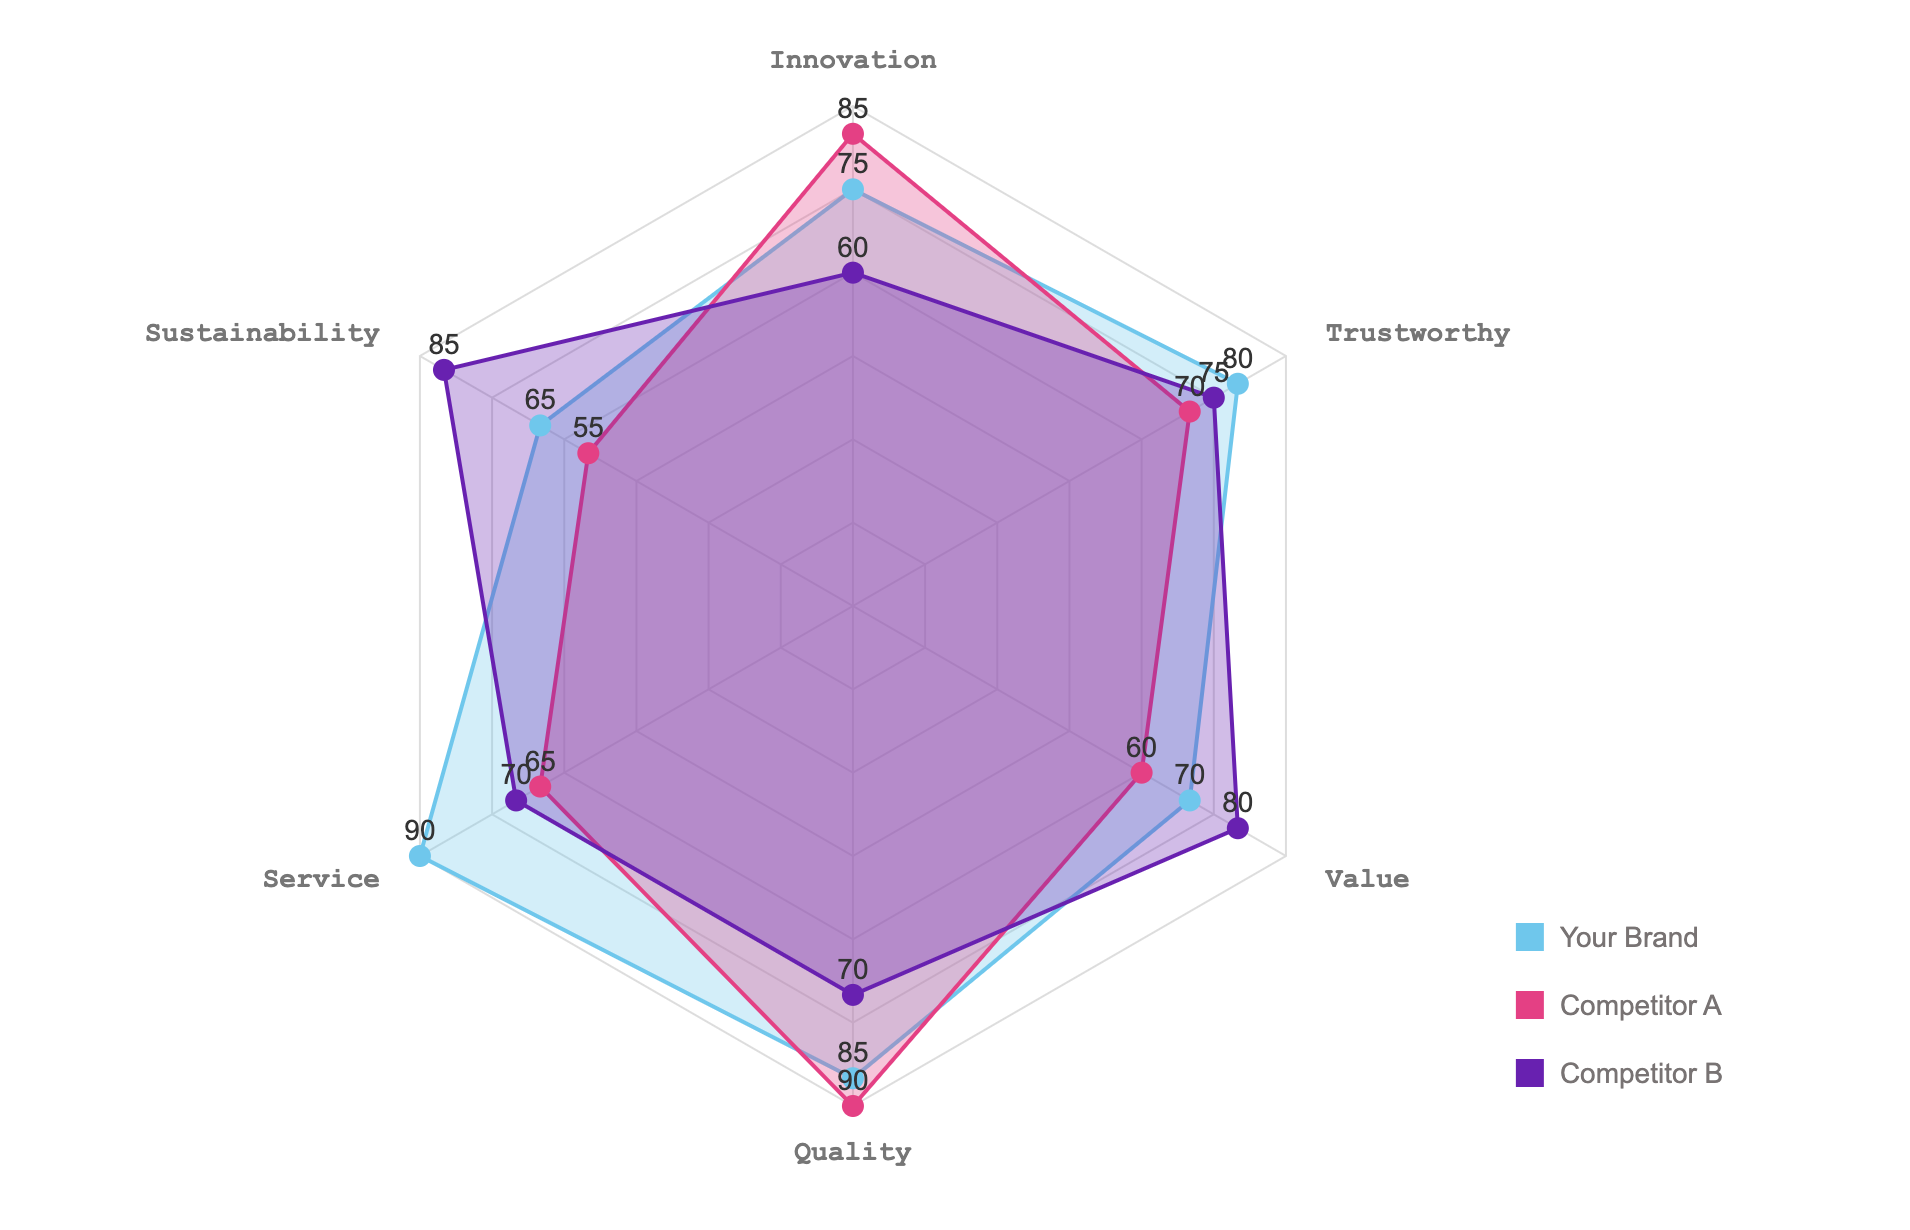
You can create a dashboard slide with a few key visuals:
- A Funnel Chart to track your social ad conversion rates.
- A Grouped Bar Chart to compare engagement metrics (likes, comments, shares) for your top posts.
- A Radar Chart (like the one above) to visualize brand perception or content performance across different platforms.
You build each chart once, dialing in your exact brand colors, fonts, and layout. Then you click "Create," and a crystal-clear image of your chart is placed on the slide.
The Magic: How the Dashboard "Updates Itself"
Okay, here’s the secret sauce. This is what turns your static slide into a living dashboard.
Next week, when you have new numbers, you don’t start from scratch.
- Open your Google Slides presentation.
- Click on the chart image you want to update.
- Launch ExtraChart from the Extensions menu.
Because the chart was made with ExtraChart, the add-on recognizes it. It instantly re-opens the editor with your exact data and settings already loaded.
From there, you just:
- Click the Data tab.
- Copy your new row of data from Excel or a CSV.
- Paste it directly into the editor.
- Click "Update Chart."
That’s it. Your chart is updated with the new data while preserving every single customization you made—the colors, the font sizes, the legend position, everything. You just saved yourself 20 minutes of mind-numbing work. Do that for three or four charts, and you've reclaimed an hour of your week.
Stop rebuilding. Start updating. Turn that dreaded weekly task into a quick, satisfying win and spend your time on what actually matters: turning those numbers into insights.
Ready to build a smarter report? Install ExtraChart from the Marketplace and get your first 10 charts on us.