How to Create a Dynamic Funnel Chart in Google Slides™ (Without Weak Templates)
December 19, 2025
If you’ve ever tried to create a sales or marketing funnel in Google Slides™, you know the struggle.
You go to Insert > Diagram, click through the categories like "Process" or "Relationship," and realize... there is no funnel. You might try to hack a "Hierarchy" diagram upside down or manually draw shapes, but it’s a design nightmare.
You can’t change the data easily, you can’t show precise percentages, and if your pipeline changes, you have to manually resize every single block.
It’s a design nightmare.
In this guide, I’ll show you how to break free from rigid templates and create a dynamic funnel chart directly inside Google Slides™—one that actually reflects your data and looks professional in seconds.
Why Google Slides™ Native "Workarounds" Fail
Most people settle for manual shapes or "funnel templates" they find online. Here’s why that’s a bad idea for your next big presentation:
- They aren't data-driven: You have to "eyeball" the width of each stage.
- Hard to update: Changing one number means redesigning the entire slide manually.
- Inconsistent design: Most external templates don't match your brand colors, and those "Process" diagrams in Google Slides™ are too rigid.
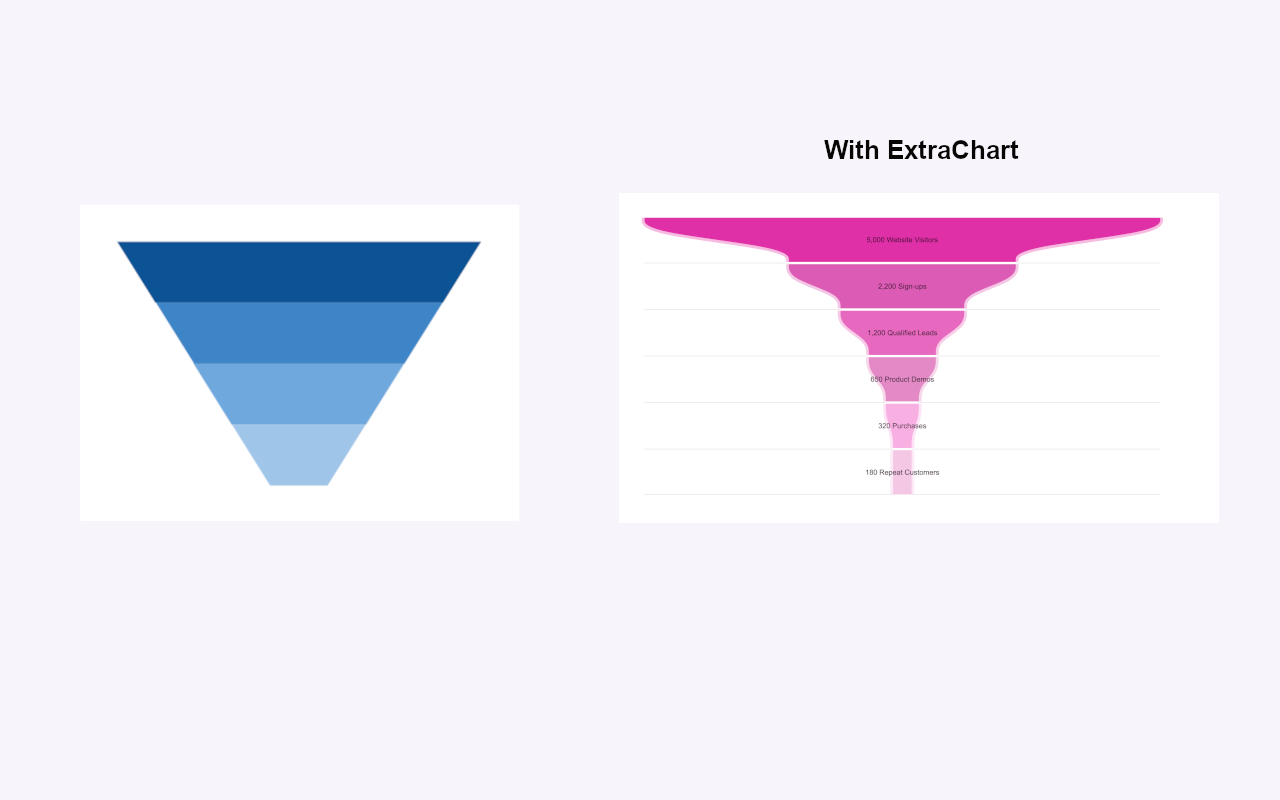 Stop settling for static shapes. See the difference between a manual Google Slides™ workaround and a data-driven, branded funnel chart created with ExtraChart.
Step-by-Step: Creating a Dynamic Funnel Chart
To do this right, we’ll use the ExtraChart Add-on. It’s a powerful tool that brings advanced data visualization (like funnels, heatmaps, and radar charts) directly into your Slides workflow.
Step 1: Open ExtraChart
Once you’ve installed the add-on, go to your top menu and select Extensions > ExtraChart > Create & Edit Charts. You’ll see a sidebar with a library of advanced chart types.
Step 2: Choose the Funnel Chart
In the ExtraChart library, find the Funnel category. Click on it to open the chart editor.
Step 3: Input Your Data (No Google Sheets™ required!)
One of the best things about ExtraChart is the native data editor. You don't have to switch back and forth between Slides and Sheets™.
- Click the Data tab in the editor.
- Type in your stage names (e.g., Website Visitors,Sign-ups, Qualified Leads, Product Demos, Purchases, Repeat Customers).
- Enter your values.
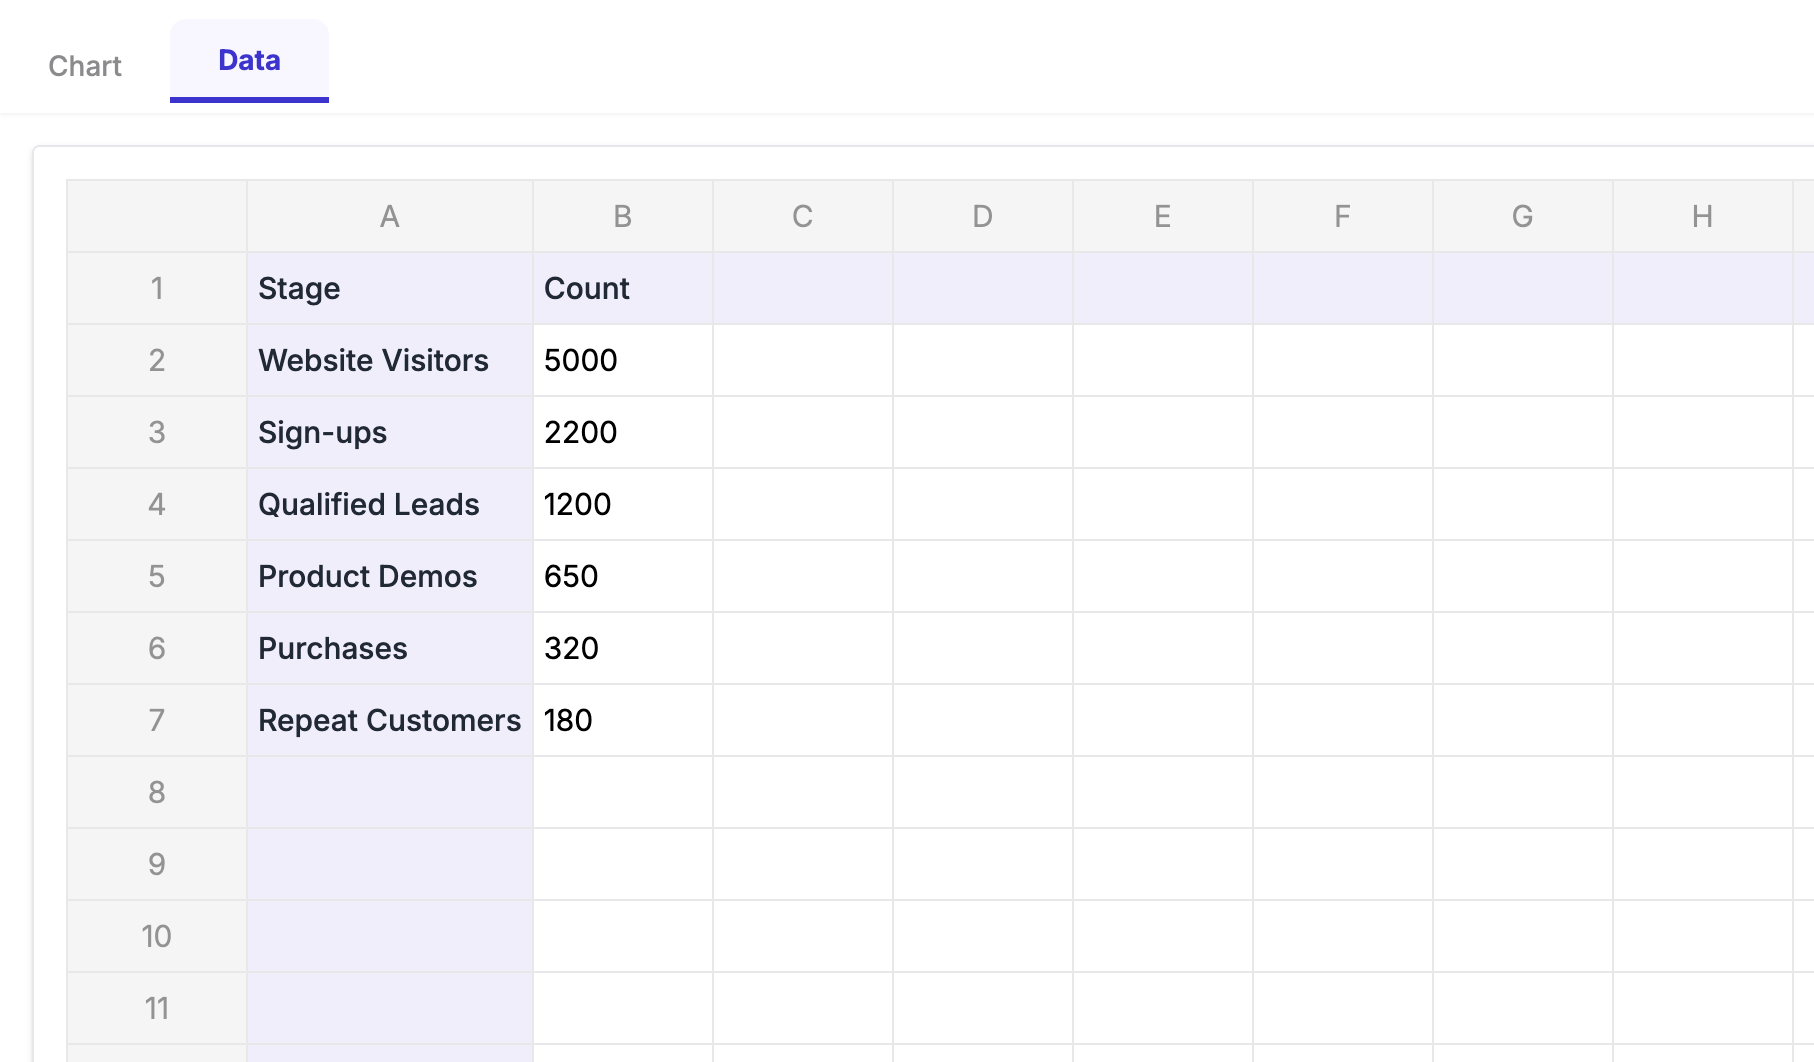 The ExtraChart data editor allows you to type sales stages and values directly within Google Slides™, eliminating the need to switch tabs or sync with Google Sheets™.
Step 4: Customize the Look
Don’t settle for default colors. Use the Settings sidebar to:
- Apply Curated Palettes: Choose from "Aqua Serenity" or vibrant "Sunset" gradients to make your funnel pop.
- Adjust Spacing: Control the "gap" between stages for a modern, clean look.
- Adjust Border Opacity and Shape Blending
Step 5: Insert and Sync
Click Insert the chart . ExtraChart generates a high-quality image and places it perfectly on your slide.
Pro Tip: If your data changes later, just select the chart and click Edit a chart in the ExtraChart sidebar. Your data will reload instantly, and you can update the stage values in seconds.
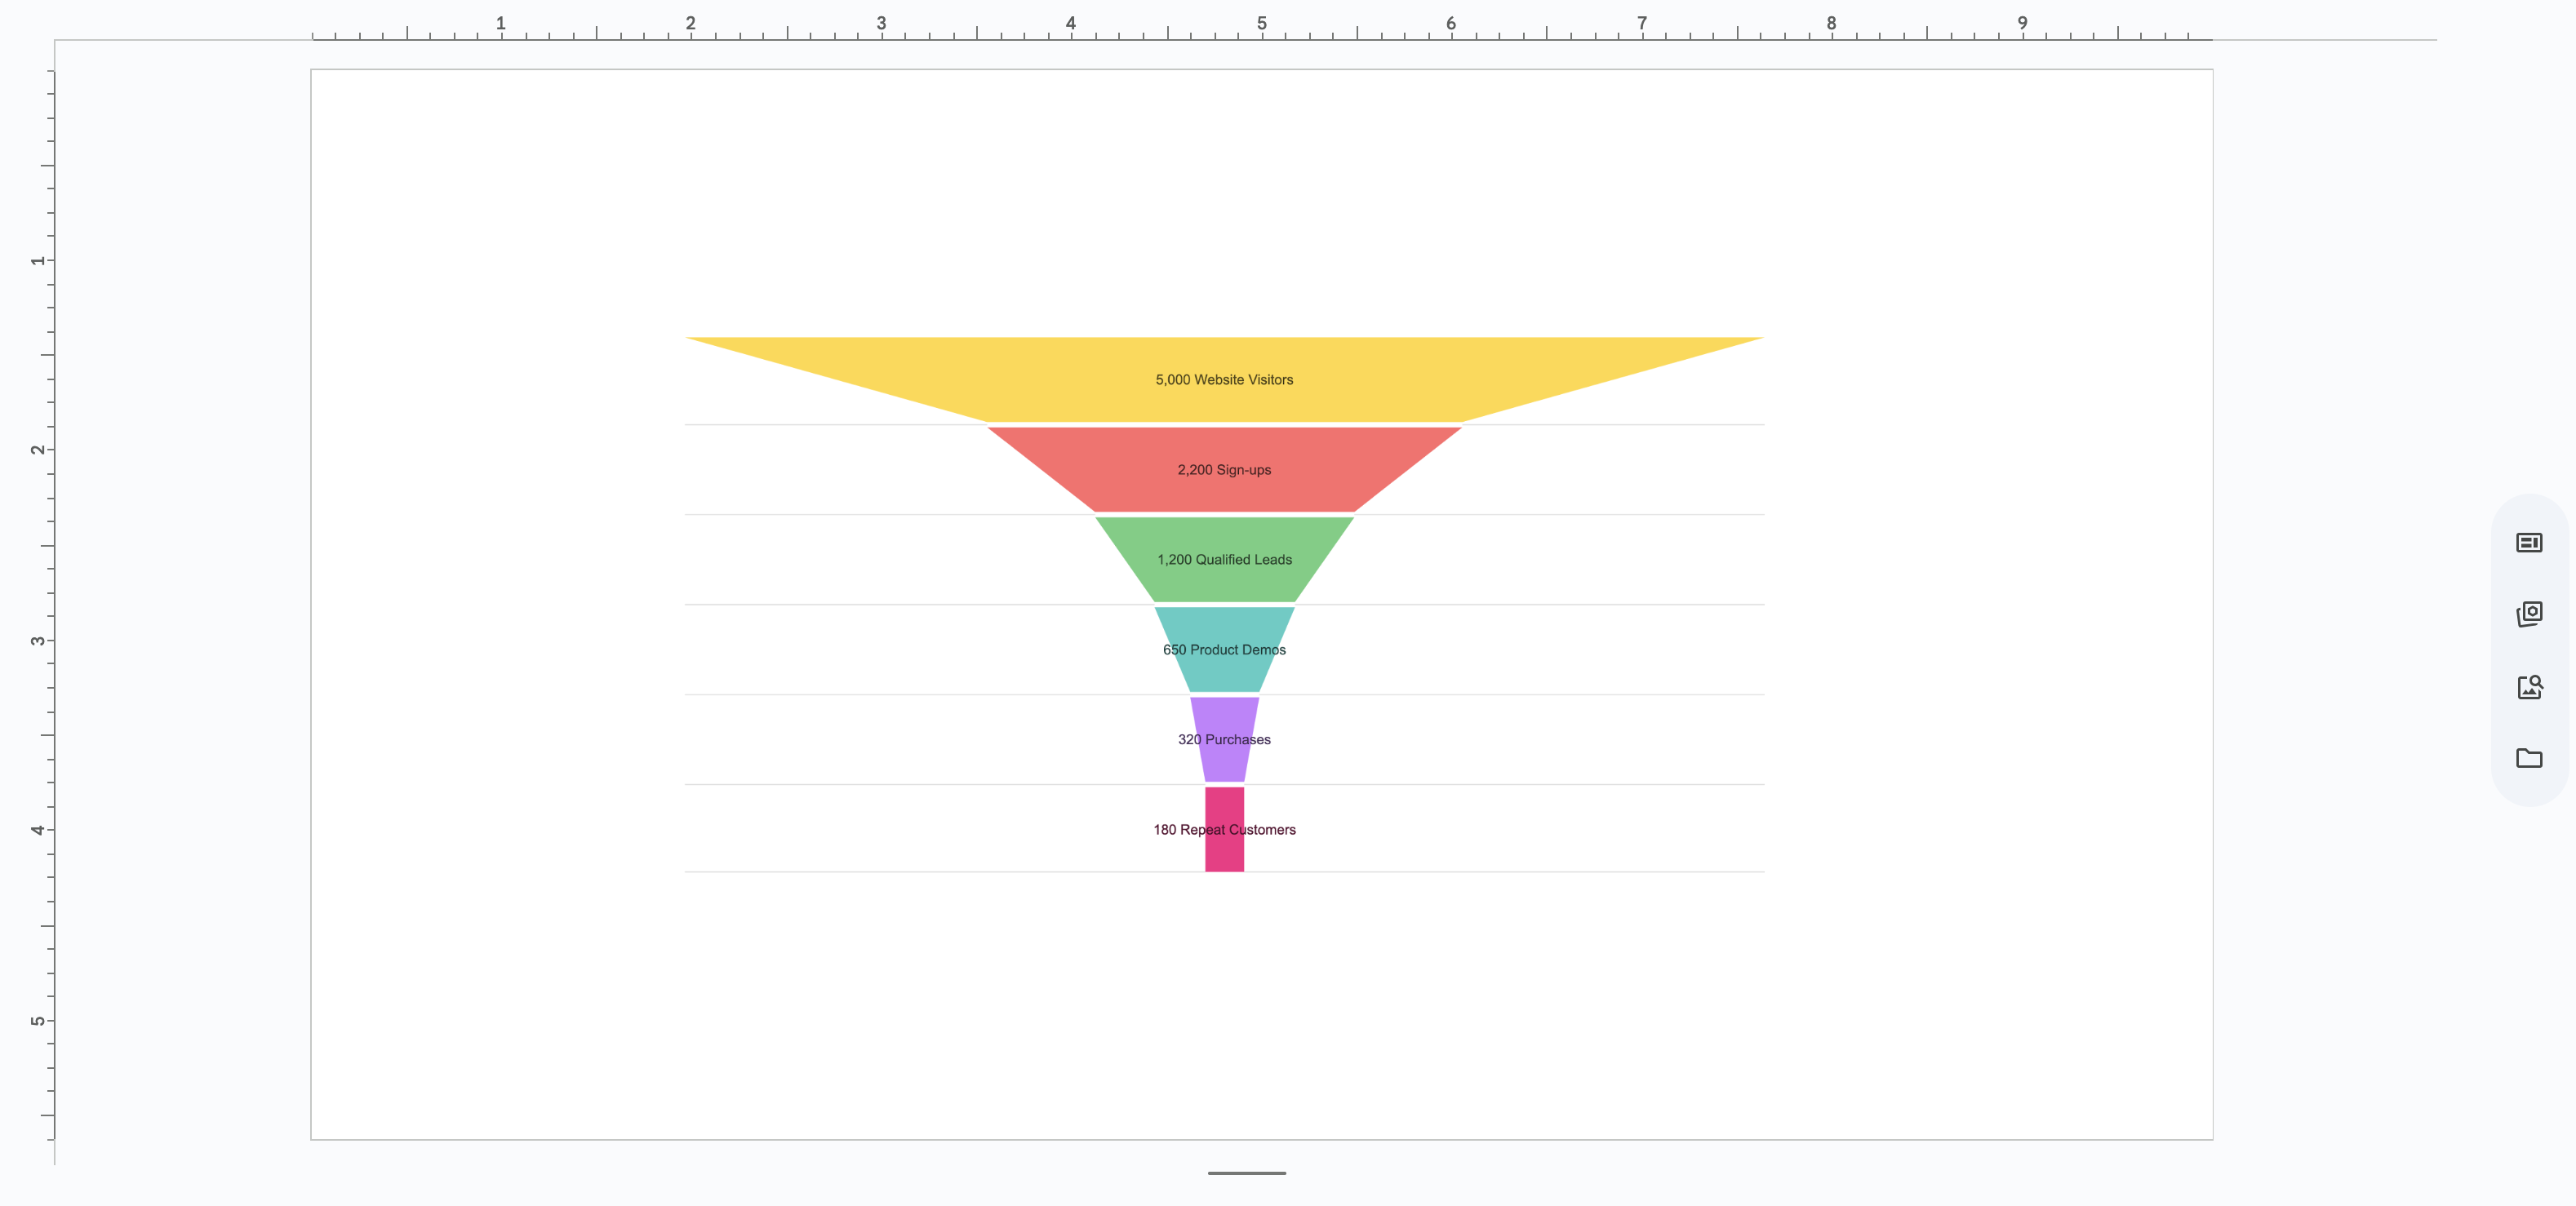 The final result: a high-resolution, professional funnel chart that stays sharp and is incredibly easy to update as your pipeline numbers change.
Best Practices for Funnel Visualizations
- Keep it clean: Don't use more than 5-7 stages. A cluttered funnel is hard to read.
- Use color to show drop-off: Use darker shades for the top of the funnel and lighter shades as you move toward the "Purchase" stage to guide the viewer's eye.
- Highlight the "Win": Make the final conversion stage a distinct color if you really want to emphasize your success.
Ready to Elevate Your Presentations?
Stop wasting hours fighting with static templates. Whether you're presenting a sales pipeline, a marketing conversion journey, or a recruitment process, a dynamic chart tells a much more compelling story.
Create Stunning Funnel Charts Instantly
Try ExtraChart to build professional Funnel charts directly in Google Slides™.
Get Started for Free