5 Killer Funnel Chart Templates for Google Slides (and How to Build Them Fast!)
January 29, 2026
Visualizing conversion funnels, sales pipelines, and multi-stage processes in Google Slides can be challenging with the platform's limited native charting capabilities. While Google Slides excels at presentation design, it lacks built-in support for funnel charts—a critical visualization for tracking how data flows through sequential stages.
In this guide, I'll walk you through five proven funnel chart templates optimized for common business scenarios, and show you how to build them efficiently using ExtraChart, a Google Slides add-on designed specifically for advanced data visualization.
Why Funnel Charts Matter for Business Presentations
Funnel charts are purpose-built for visualizing sequential processes where volume decreases at each stage. They're particularly valuable for:
- Sales pipeline analysis: Track lead progression from initial contact to closed deals
- Conversion rate optimization: Identify drop-off points in customer journeys
- Recruitment funnels: Monitor candidate flow through hiring stages
- Marketing campaign performance: Measure engagement through awareness, consideration, and conversion phases
The challenge? Google Slides doesn't offer native funnel chart functionality. Most users resort to manually stacking shapes or importing static images from external tools—both approaches that break when data changes.
5 Professional Funnel Chart Templates
1. The Sales Pipeline Tracker
Use Case: B2B sales teams tracking opportunities through qualification stages
Data Structure:
- Stage 1: Initial Outreach (100 leads)
- Stage 2: Qualified Prospects (65 leads, 65% conversion)
- Stage 3: Demo Scheduled (42 leads, 65% conversion)
- Stage 4: Proposal Sent (28 leads, 67% conversion)
- Stage 5: Closed-Won (15 deals, 54% conversion)
Key Insight: This template helps identify where your sales process is leaking. If you see a dramatic drop between Stages 3 and 4, it signals that your demo-to-proposal conversion needs attention.
2. The E-commerce Conversion Funnel
Use Case: Online retailers optimizing checkout flow
Data Structure:
- Homepage Visitors: 10,000
- Product Page Views: 3,200 (32% engagement)
- Add to Cart: 960 (30% of viewers)
- Checkout Initiated: 480 (50% cart conversion)
- Purchase Completed: 336 (70% checkout completion)
Key Insight: This reveals your biggest friction points. A 30% drop from cart to checkout? You might have hidden shipping costs or a complicated checkout process.
3. The Content Marketing Funnel
Use Case: Content teams measuring engagement depth
Data Structure:
- Blog Visitors: 5,000
- Newsletter Signups: 250 (5% conversion)
- Resource Downloads: 125 (50% engagement)
- Demo Requests: 38 (30% of downloads)
- Qualified Leads: 19 (50% qualification rate)
Key Insight: Shows how content drives qualified pipeline. If downloads are high but demo requests are low, your resources may not be addressing buyer pain points.
4. The Recruitment Pipeline
Use Case: HR teams tracking hiring efficiency
Data Structure:
- Applications Received: 200
- Phone Screen: 80 (40% pass rate)
- First Interview: 40 (50% advance)
- Second Interview: 20 (50% advance)
- Offers Extended: 10 (50% advance)
- Offers Accepted: 8 (80% acceptance)
Key Insight: Benchmarking each stage against industry averages helps identify bottlenecks. A low acceptance rate might indicate compensation or employer brand issues.
5. The SaaS Trial-to-Paid Funnel
Use Case: Software companies optimizing free trial conversions
Data Structure:
- Trial Signups: 1,000
- Account Activated: 700 (70% activation)
- Feature Explored: 350 (50% engagement)
- Upgrade Path Viewed: 140 (40% consideration)
- Converted to Paid: 70 (50% conversion)
Key Insight: The activation and engagement stages are critical. Low activation suggests onboarding friction; low engagement indicates feature discovery problems.
Building These Funnels with ExtraChart
ExtraChart solves the Google Slides funnel chart problem directly in your presentation editor. Here's why it's the professional choice:
Workflow Advantages
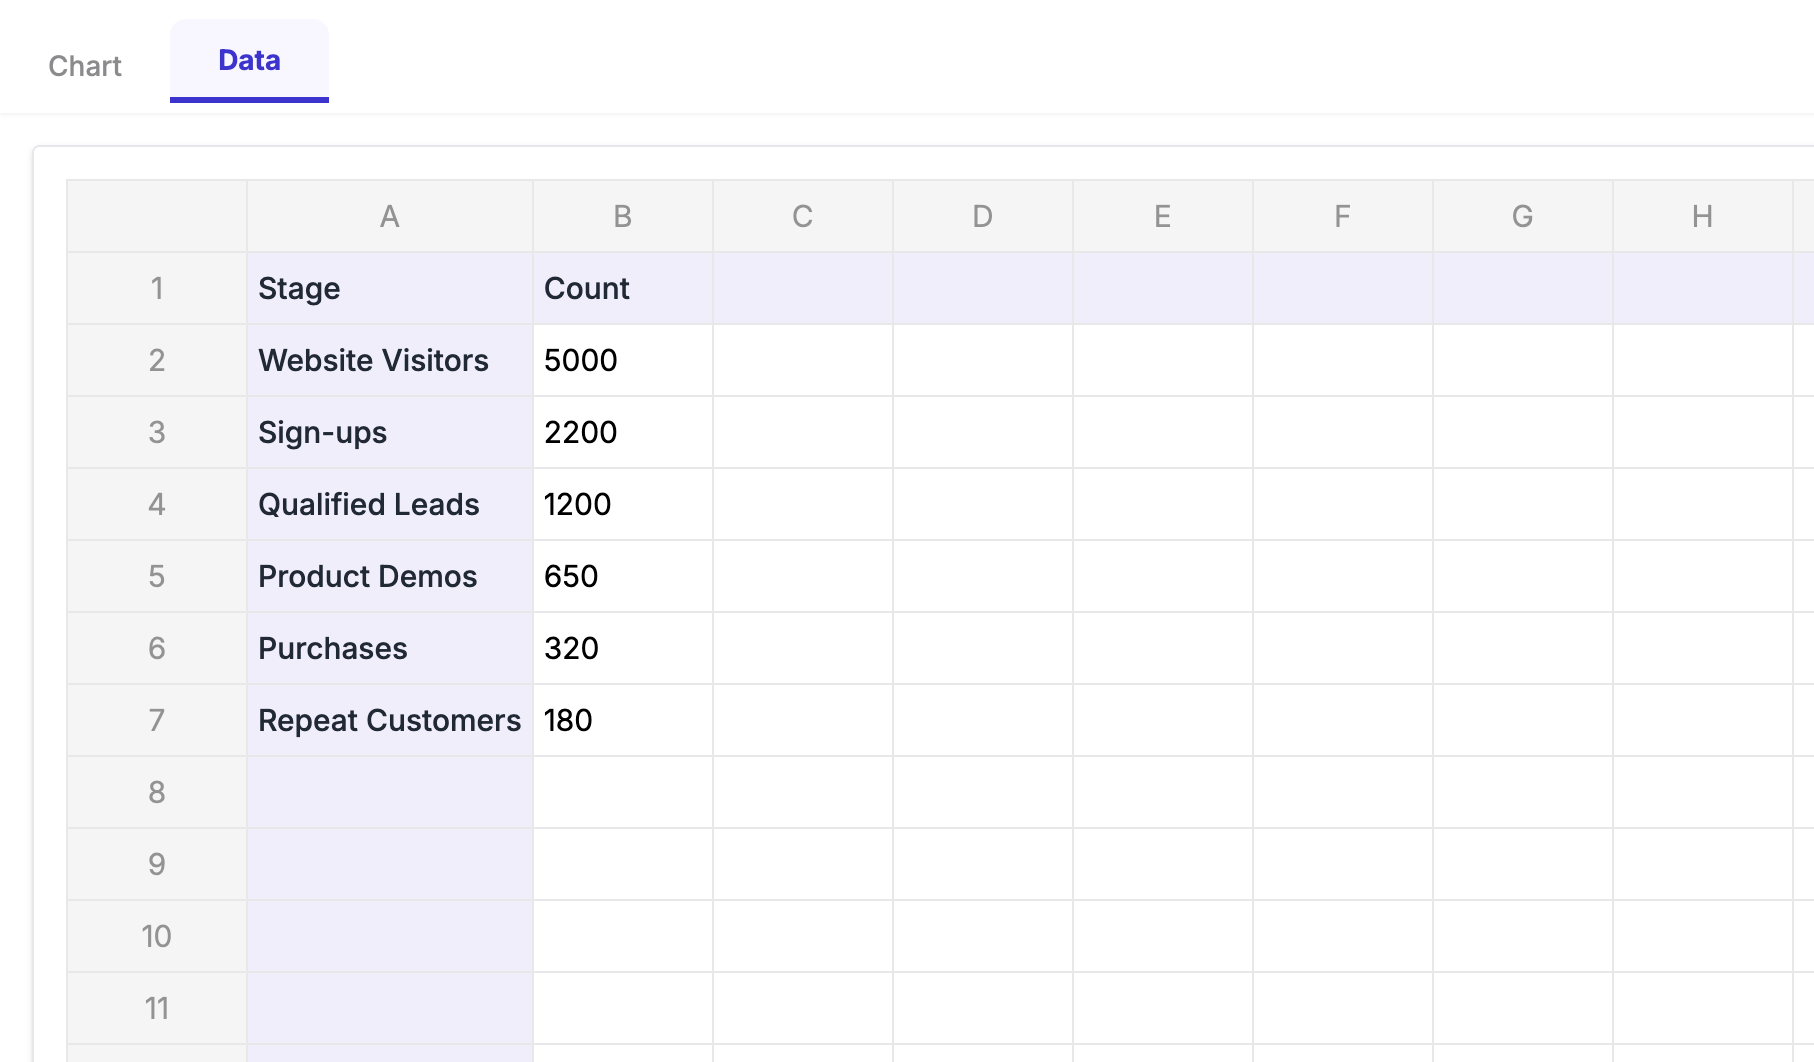
- Integrated Data Editor: Copy-paste data from Google Sheets, Excel, or CSV files directly into ExtraChart's spreadsheet interface. No external tools required.
-
Real-Time Customization: Adjust colors to match your brand palette, modify label fonts for readability, and control spacing for optimal visual hierarchy—all with instant preview.
-
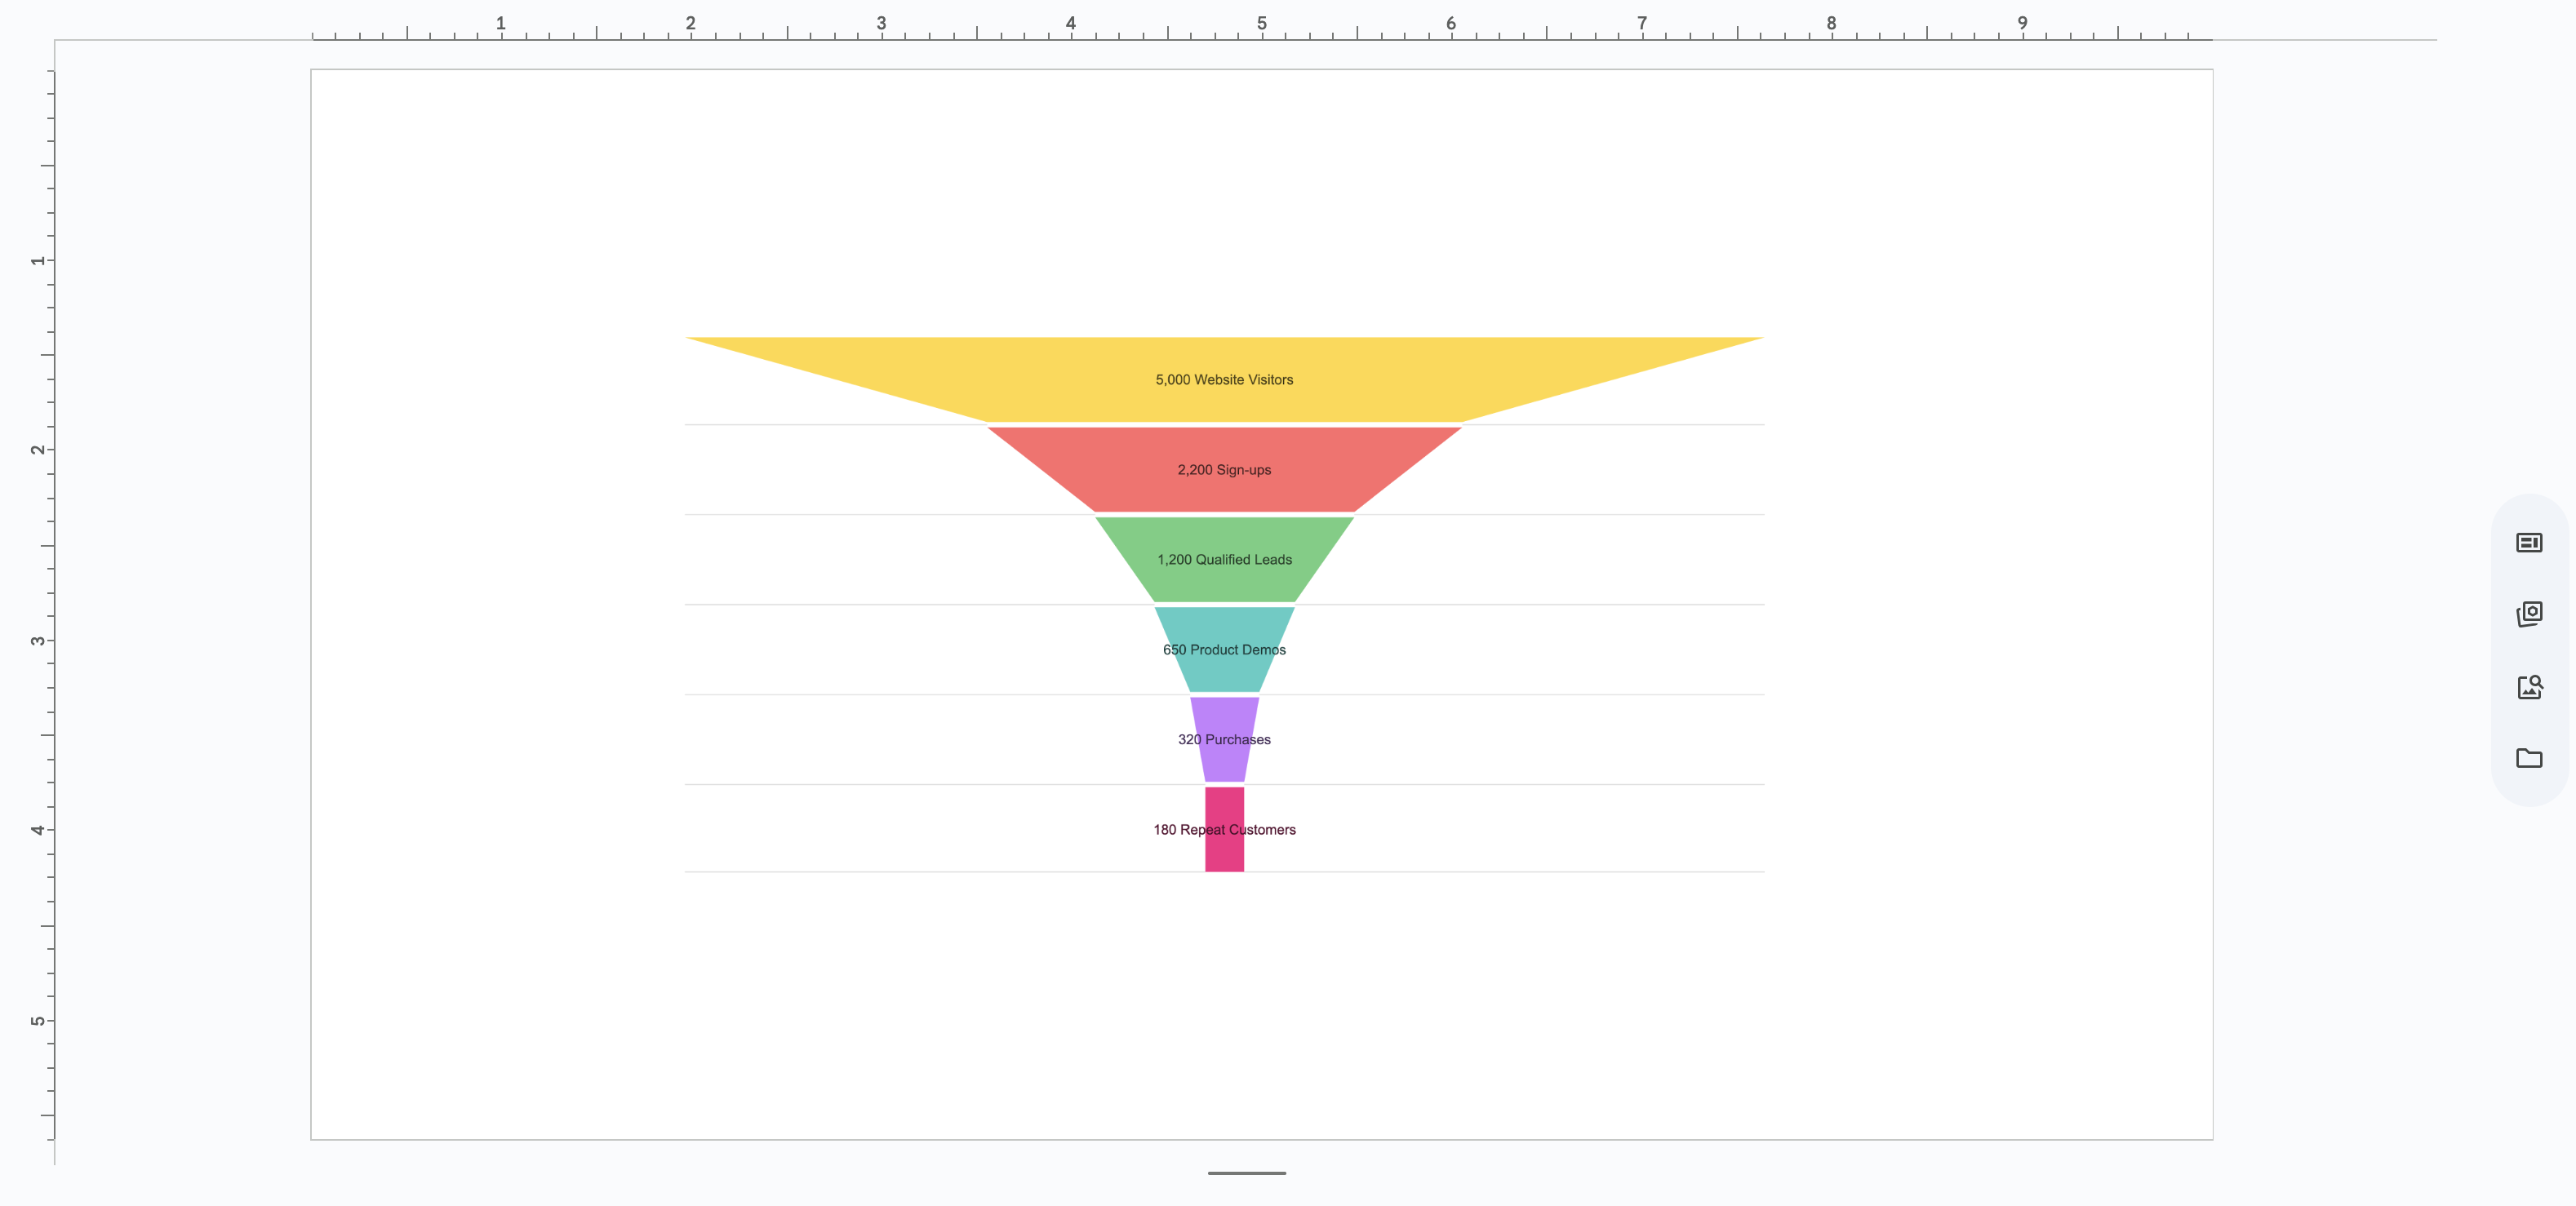
Updateable Charts: Unlike static images, ExtraChart stores your data and settings. Need to refresh numbers for a quarterly review? Select the chart, re-open ExtraChart, update the values, and click Create. Your formatting persists.
-
Professional Output: Charts render as high-resolution images, ensuring crisp visuals on any screen or projector.
Quick Implementation Guide
- Install ExtraChart from the Google Workspace Marketplace
- Open your presentation and navigate to Add-ons > ExtraChart > Start
- Select Funnel Chart from the chart type menu
- Input your stage names and values in the data editor
- Customize colors, fonts, and labels in the Settings tab
- Click Create to insert into your slide
Beyond Templates: Strategic Funnel Chart Design
Professional funnel charts do more than display data—they tell a story. Here are design principles I follow:
- Color gradient progression: Use darker shades for later stages to emphasize the narrowing effect
- Percentage labels: Always show conversion rates between stages, not just absolute numbers
- Comparative views: Place multiple funnels side-by-side to compare time periods or segments
- Annotation focus: Highlight your key finding with a text box or callout
When to Use Which Template
| Template | Best For | Update Frequency |
|---|---|---|
| Sales Pipeline | Weekly pipeline reviews | Weekly |
| E-commerce Conversion | Monthly performance reports | Monthly |
| Content Marketing | Quarterly strategy meetings | Quarterly |
| Recruitment | Hiring retrospectives | Per hiring cycle |
| SaaS Trial | Board presentations | Monthly |
Final Thoughts
Funnel charts transform complex sequential data into intuitive visuals that drive action. With ExtraChart, you can build professional-grade funnel charts in minutes—no design skills or external software required.
The templates above cover the most common business scenarios, but the real power comes from adapting them to your specific metrics and KPIs. Start with the template that matches your use case, customize it with your data, and let the visual insights guide your next strategic move.